You should spend about 20 minutes on this task.
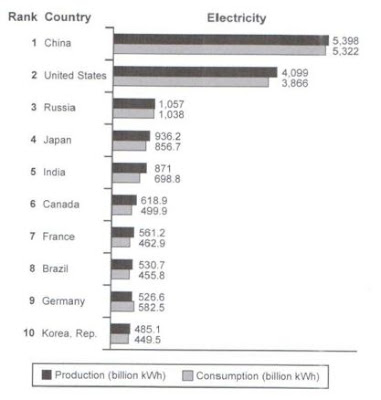
The bar chart below shows the top ten countries for the production and
consumption of electricity in 2014.
Summarise the information by selecting and reporting the main features,
and make comparisons where relevant.
Write at least 150 words.
SAMPLE ANSWER:
The bar chart compares 10 highest-ranking countries in terms of
electricity generation and consumption in 2014.
Overall,
the amounts of electricity produced and consumed in China and the US were far
higher than the other nations. It is also noticeable that Germany was the only
country that consumed more electricity than it generated.
Out
of the 10 nations, China ranked first with the production and
consumption of electricity being just over 5,300 billion kWh
each. The US, the
second largest electricity producer and consumer, generated
4,099 billion kWh and consumed 3,866 billion kWh.
Looking
at the remaining countries, we can see that Russia was the only nation with
electricity generation and consumption being just over 1,000 billion kWh each, followed
by Japan and India, with the figures being slightly
lower, ranging from 698.8 to 1,057 billion kWh. The figures for the other
countries show a difference in production and
consumption of electricity at around 50-150 billion kWh, while it is
interesting to note that Germany produced 526.6 billion kWh of electricity, but
it consumed 582.5 billion kWh.
(177
words, band 8.0, written by Nguyen Huyen)


No comments:
Post a Comment